Vehicle data analysis
When selecting Vehicle, Aquaji will display information about the vehicles it detected. This assumes that you have outside cameras pointed towards a roadway (for example, a parking lot or drive-through entrance).
REMEMBER! Each time you navigate between tabs you must click the PROCEED button to refresh the screen.
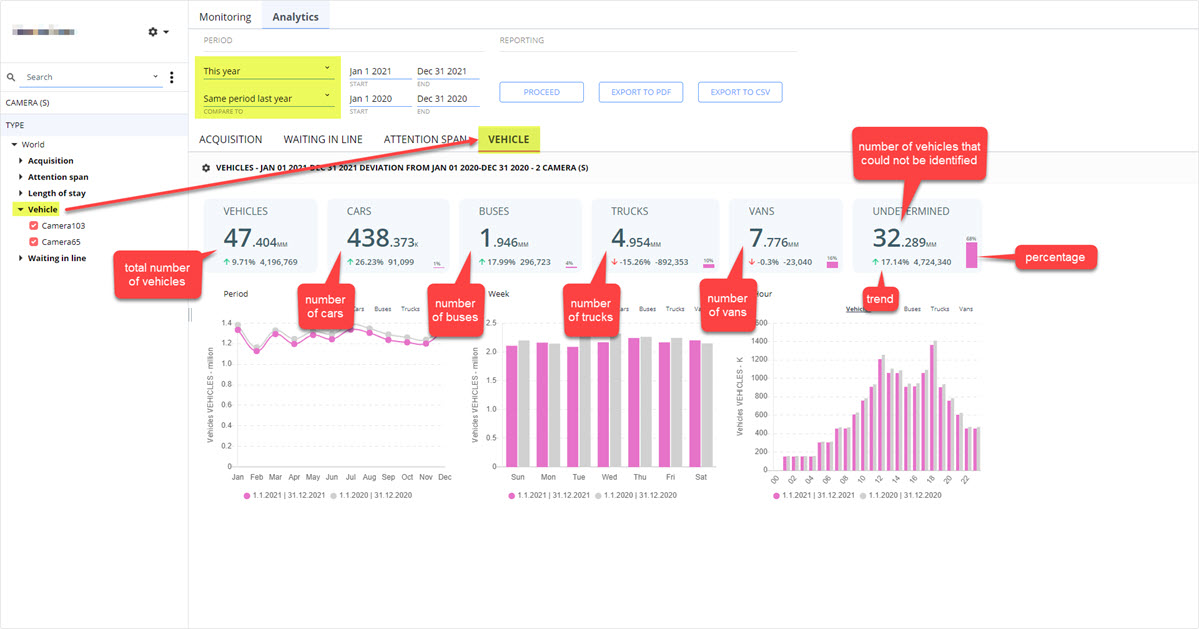
Vehicle data includes:
- Total number of vehicles detected.
- Number of cars.
- Number of buses.
- Number of trucks.
- Number of vans.
- Number of vehicles that could not be identified or assigned a category.
- Percentage and trends.
Graphs and charts:
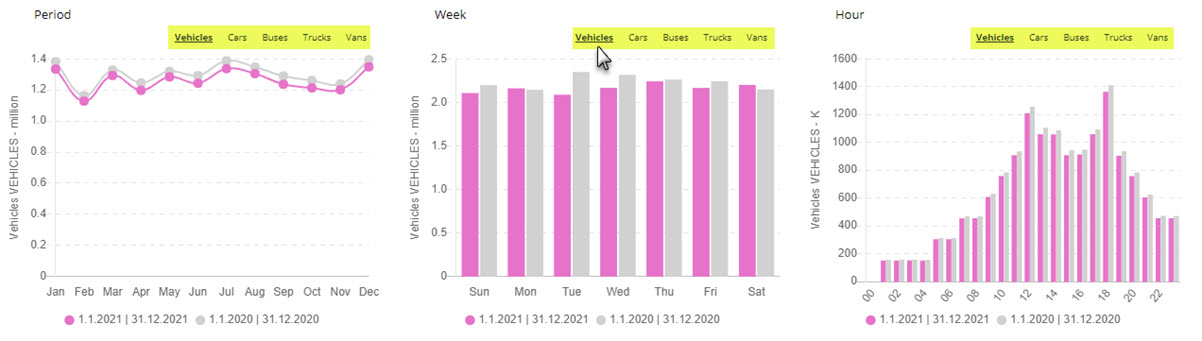
Aquaji displays its statistics using graphs and charts. You can change views via the options that appear in the upper right corner of each one. The options will change depending on the type of data viewed.
The example below shows the options when viewing the vehicle type metrics.
Here are some examples:
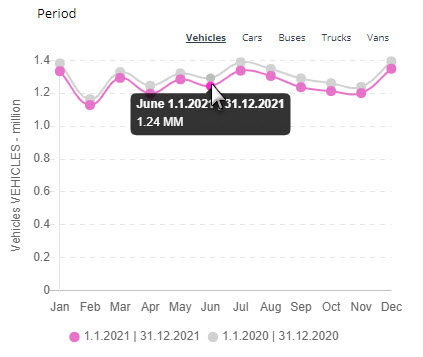
Positioning your mouse cursor on any part of a graph will bring up additional information:
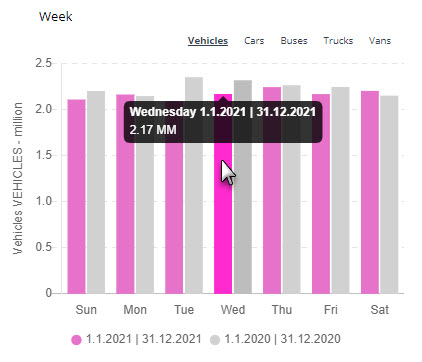
Same goes for bar charts:
REMEMBER! You can click the selections above each graph or chart to change the view.