Attention span data analysis
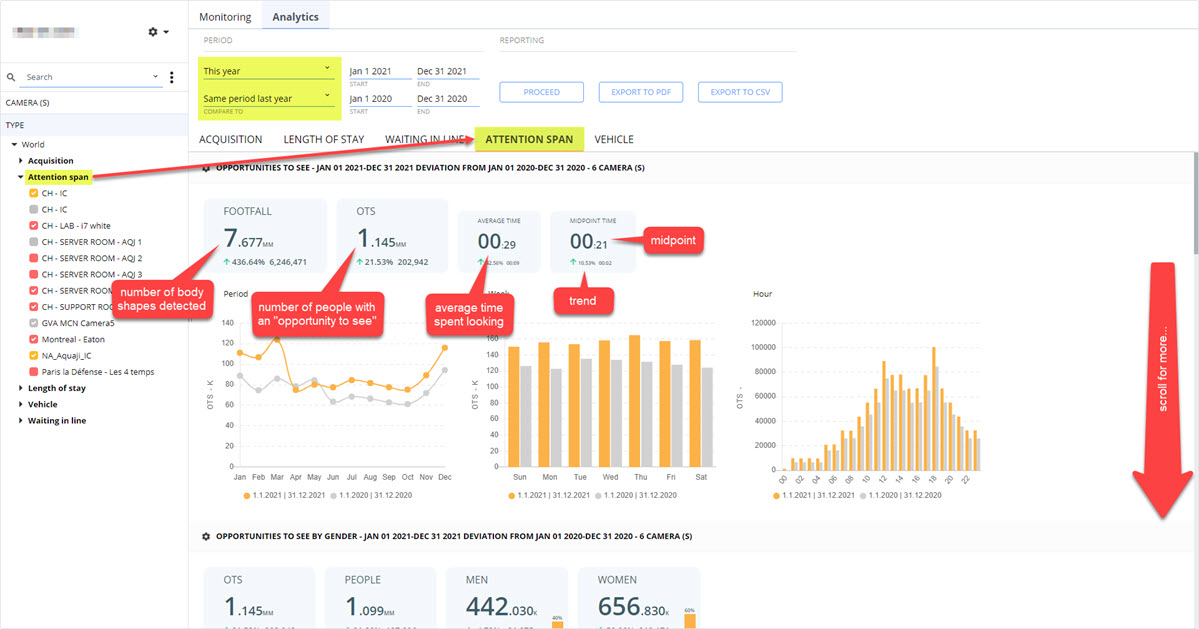
When selecting Attention span, Aquaji will display information about how much time visitors are paying attention based on their angle of view in reference to the camera.
REMEMBER! Each time you navigate between tabs you must click the PROCEED button to refresh the screen.
Attention span reports have 6 sections.
You scroll down the page to view each section:
- Opportunities to see.
- Opportunities to see by gender.
- Opportunities to see by age range.
- Conversions.
- Conversions by gender.
- Conversions by age range.
Graphs and charts:
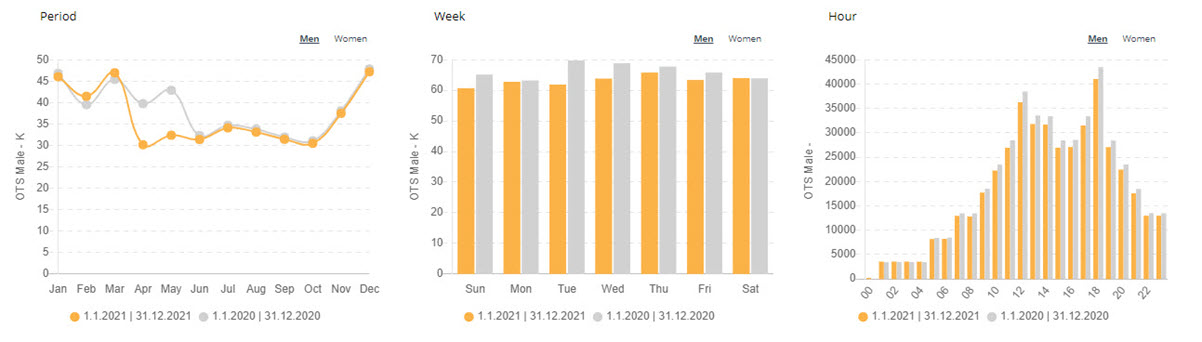
Aquaji displays its statistics using graphs and charts. You can change views via the options that appear in the upper right corner of each one. The options will change depending on the type of data viewed.
The example below shows the options when looking at gender metrics, the options will be men/women and when looking at age range you can select between each range.
Here are some examples:
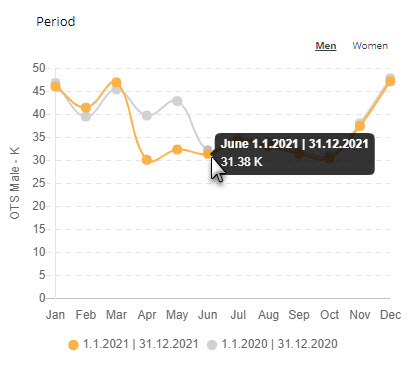
Positioning your mouse cursor on any part of a graph will bring up additional information:
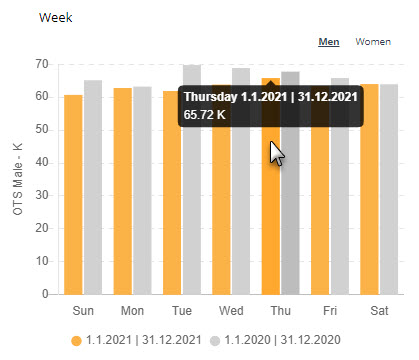
Same goes for bar charts:
Gender
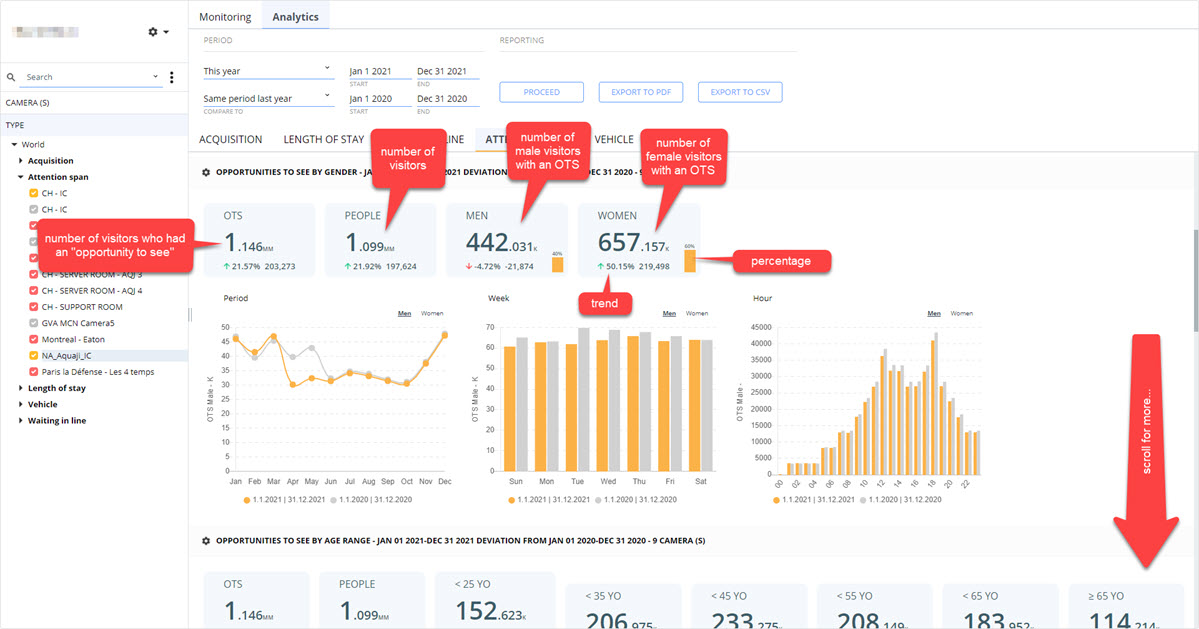
Gender data includes:
- The number of visitors who had an "opportunity to see".
- The total number of people detected.
- The number of visitors with an "OTS" who were identified as male.
- The number of visitors with an "OTS" who were identified as female.
- Percentages and trends.
REMEMBER! You can click the selections above each graph or chart to change the view.
Age range
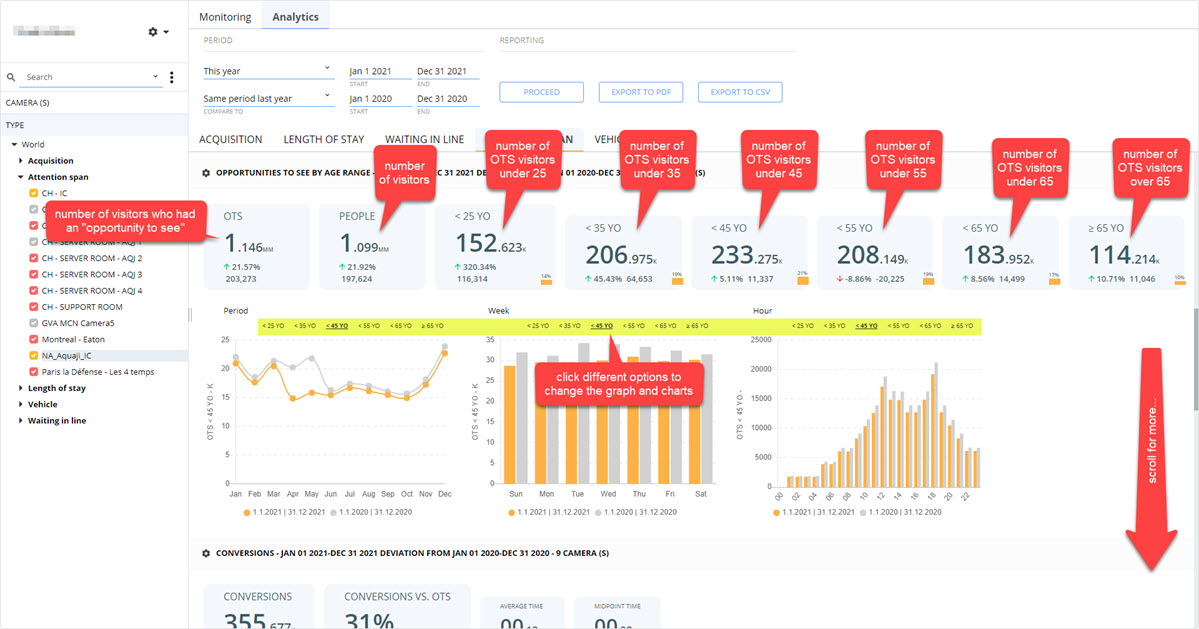
Age range data includes:
- The number of visitors who had an "opportunity to see".
- The total number of people detected.
- The number of people with an "OTS" who are under 25.
- ...who are under 35,
- ...who are under 45.
- ...who are under 55.
- ...who are under 65.
- ...who are above 65.
- Percentages and trends.
REMEMBER! You can click the selections above each graph or chart to change the view.
Conversions
Conversions are all about engagement. A conversion is recorded when a person completes a desired goal, such as when someone pays attention to a product, a digital screen or has other types of interactions.
In this case we're calculating how many "opportunities to see" became engagements, meaning how many people purchased an item or acted on content shown on digital signage screens.
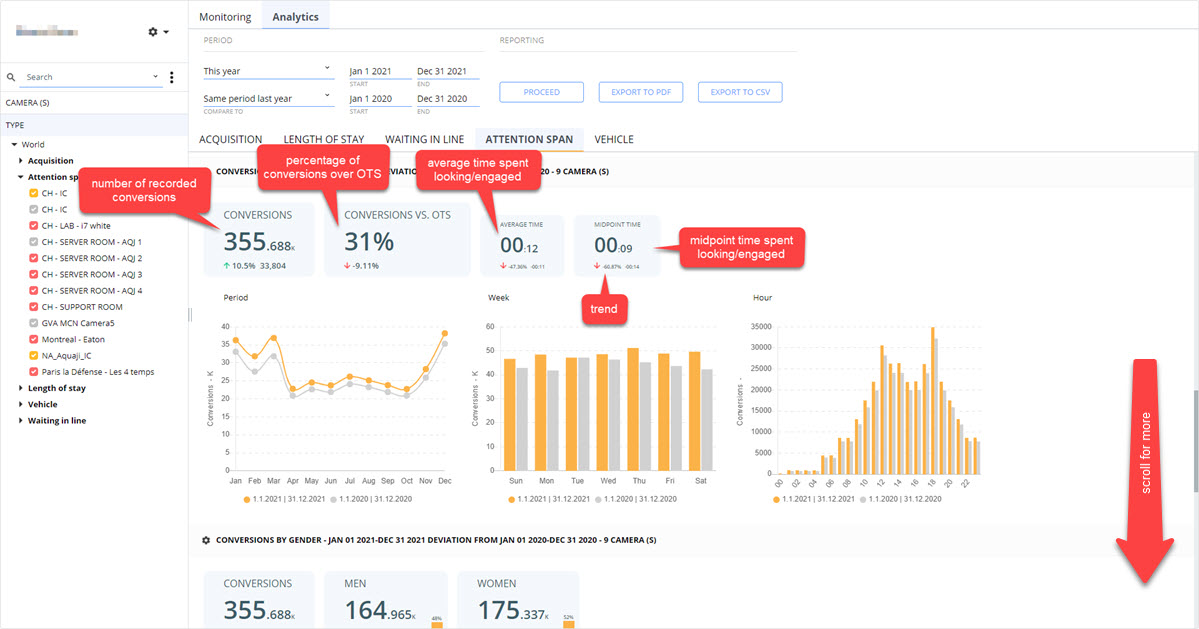
Conversion data includes:
- The number of people who were engaged.
- The ratio of conversions vs the number of "opportunities to see".
- The average engagement duration.
- The midpoint engagement duration.
- Percentages and trends.
Conversions by gender
This screen shows the gender split for all recorded conversions.
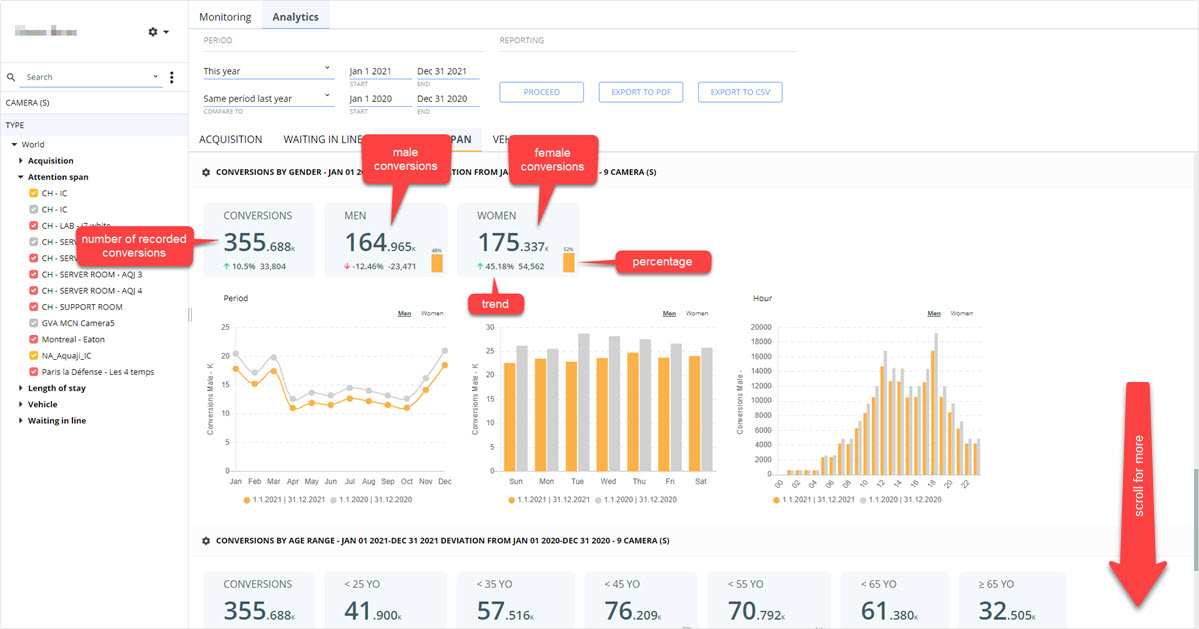
Gender data includes:
- The total number of recorded conversions.
- The number of male conversions.
- The number of female conversions.
- Trends.
REMEMBER! You can click the selections above each graph or chart to change the view.
Conversions by age range
This screen shows the breakdown by age.
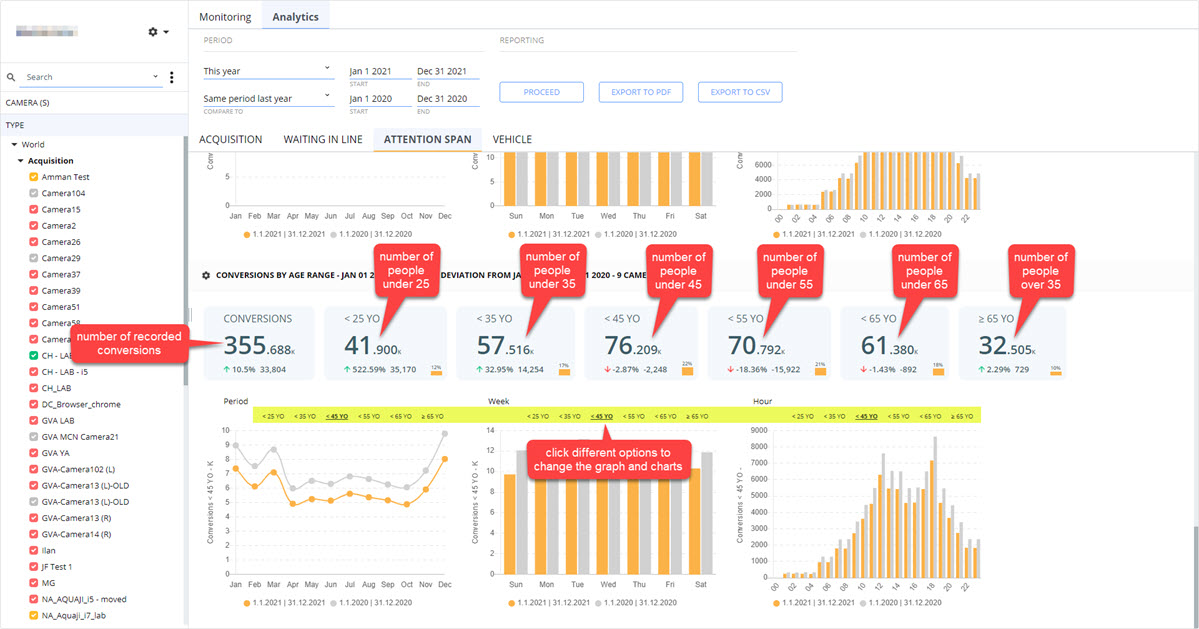
Age range data includes:
- The total number of recorded conversions.
- The number of conversions from people who are under 25.
- ...who are under 35,
- ...who are under 45.
- ...who are under 55.
- ...who are under 65.
- ...who are above 65.
- Trends.
REMEMBER! You can click the selections above each graph or chart to change the view.