Dashboard
The Aquaji server dashboard is where you can find statistics about users, cameras and you server's performance.
First page
The first page shows the Aquaji network statistics.
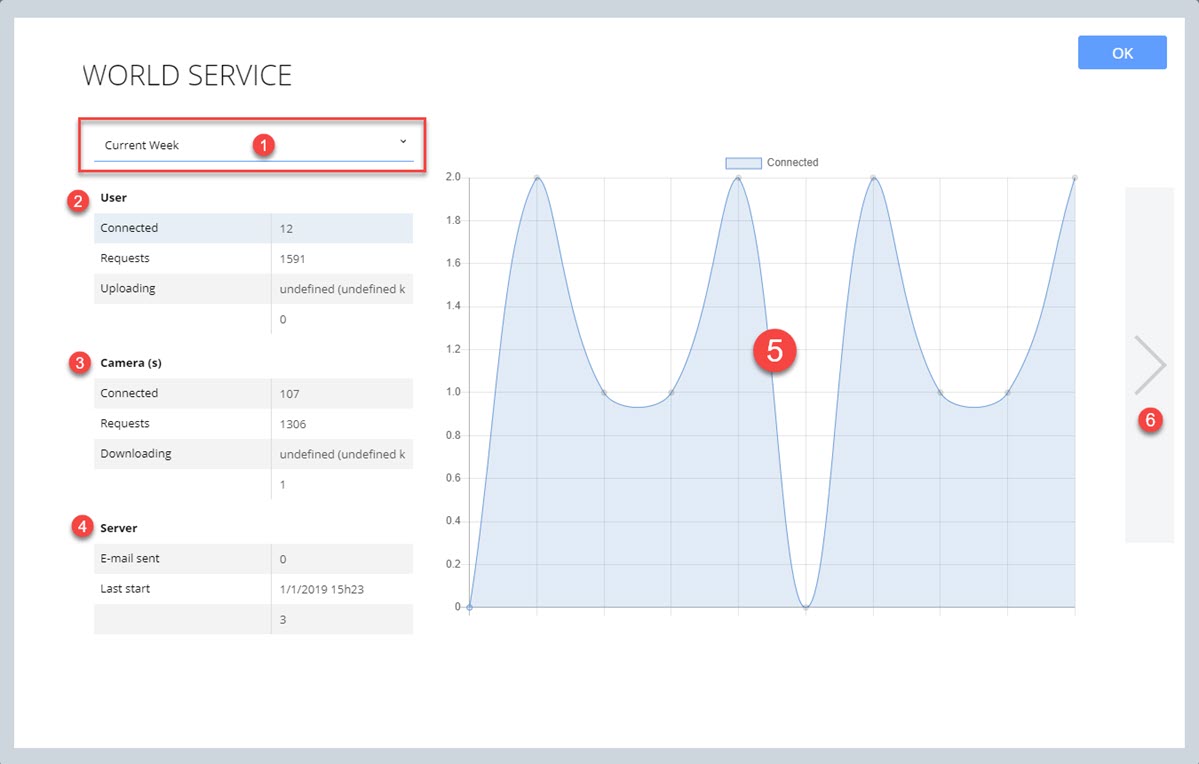
- Select a period to display in the dashboard. The default is "Today" and other options are: Current week, last two weeks and last month.
- USER statistics: Number of user connections, requests and uploaded data.
- CAMERA statistics: Number of connected devices, requests and downloaded data.
- SERVER statistics: Numbers of emails sent, last server restart.
- Chart view of the selected statistic. When you click the fields (connected, requests, uploading, downloading, email sent...) the chart will display the results in graphical form.
- Click the arrow to load the next page.
Second page
The second page is used to generate Aquaji network activity reports.
Aquaji records user interactions and stores this information in its logs. You can access this information by searching the logs as follows:
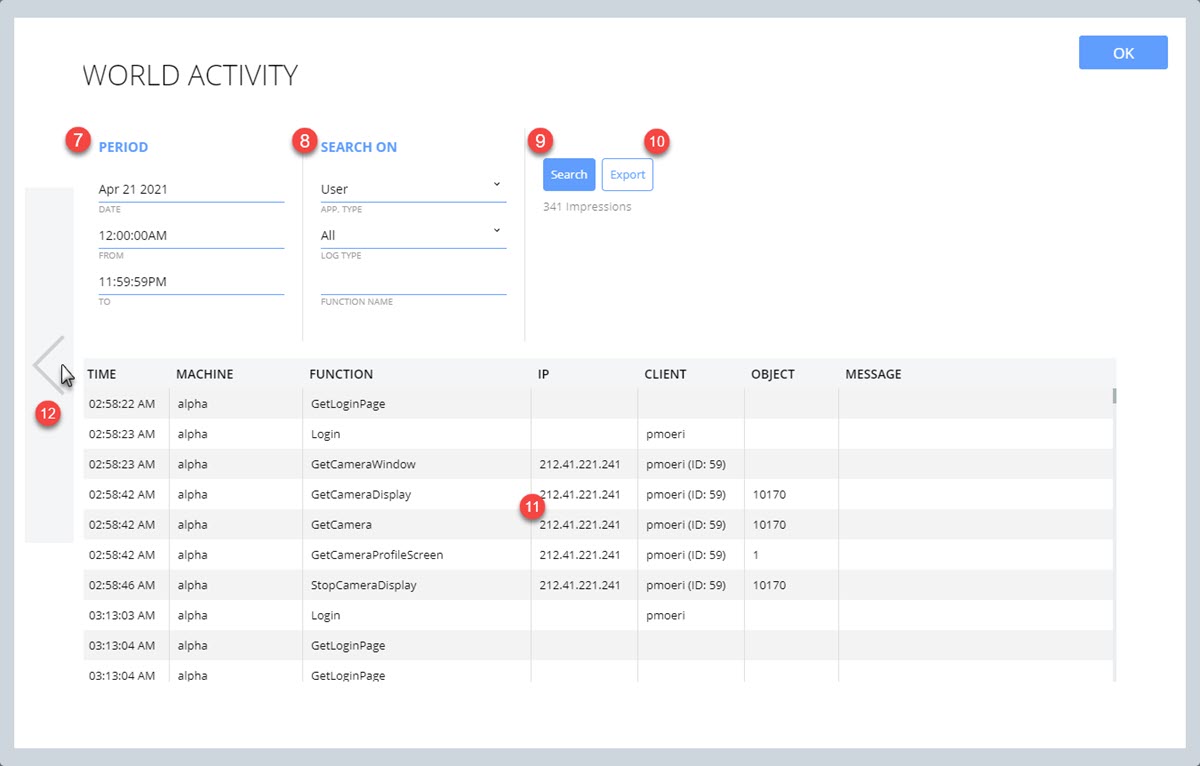
- PERIOD: Select the period for your activity report by entering the date and time span.
- SEARCH ON: Select which criteria to filter your results on.
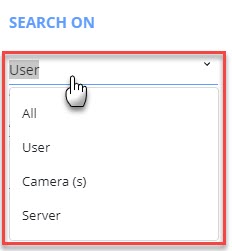
- APP TYPE: Options are: All, user, camera and server.
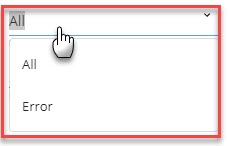
- LOG TYPE: Options are: All, error.
- FUNCTION NAME: Optional. If you enter an Aquaji function name, only those results will be shown.
- SEARCH button: Click this button to generate a new report based on the options selected on the left. The number of results will appear under the button and the results will populate the table below.
- EXPORT button: Click this button to export and download your report as a CSV file.
- RESULTS TABLE:
- TIME: The time of the event
- MACHINE: The Aquaji server name
- FUNCTION: The Aquaji function recorded.
- IP: The address of the request.
- CLIENT: User name and user ID of the person who made the request.
- OBJECT: Aquaji internal code for support purposes.
- MESSAGE: Aquaji generated message for support purposes.