Acquisition data analysis
When you select the Acquisition tab, Aquaji will display information about footfall and people counts.
REMEMBER! Each time you navigate between tabs you must click the PROCEED button to refresh the screen.
Acquisition reports have 3 sections.
You scroll down the page to view each section:
- Counting people.
- Gender
- Age range
Counting people
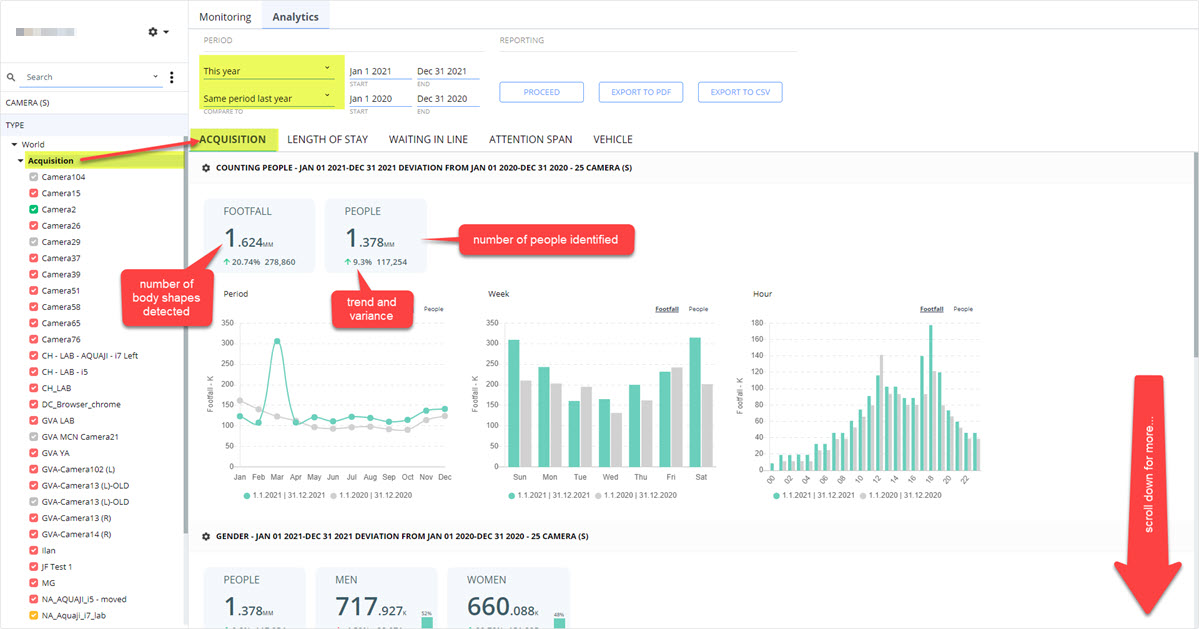
Counting People data includes:
- The number of body shapes detected (based on footfall).
- The number of people detected (based on face detection).
- Shows breakdown of:
- The number of men/women
- Age range
- Percentages and trends.
Graphs and charts:
Aquaji displays its statistics using graphs and charts.
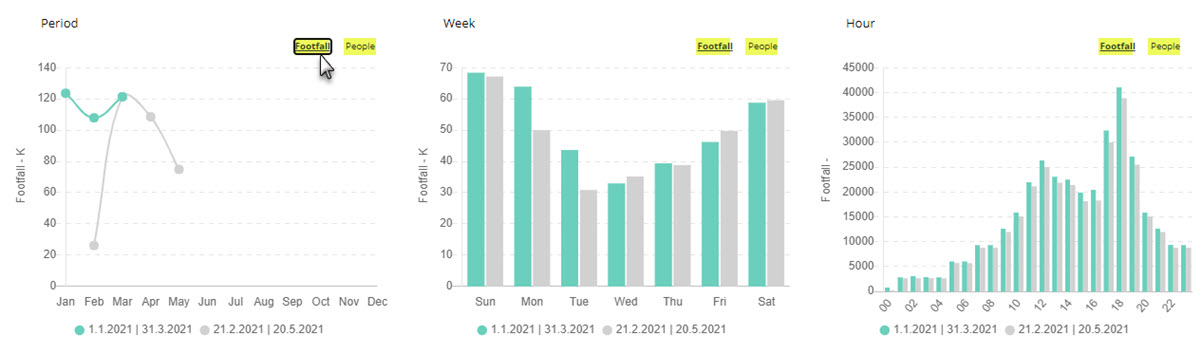
You can change views via the options that appear in the upper right corner of each one. The options will change depending on the type of data viewed.
The example below shows the options when viewing the footfall/people metrics. When looking at gender metrics, the options will be men/women and when looking at age range you can select between each range.
Here are some examples:
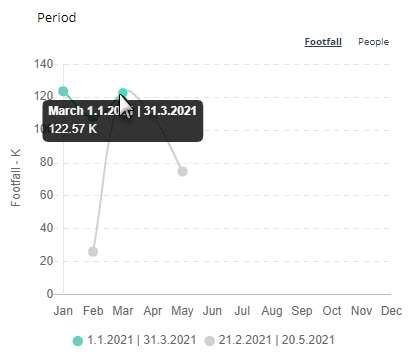
If you position your mouse cursor on any part of a graph you will see additional information:
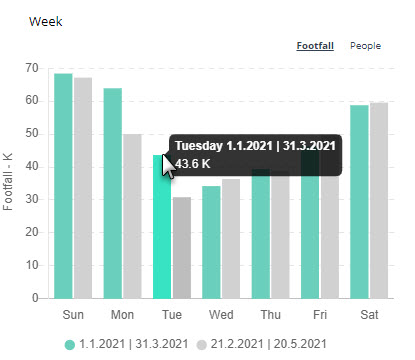
Same goes for bar charts:
Gender
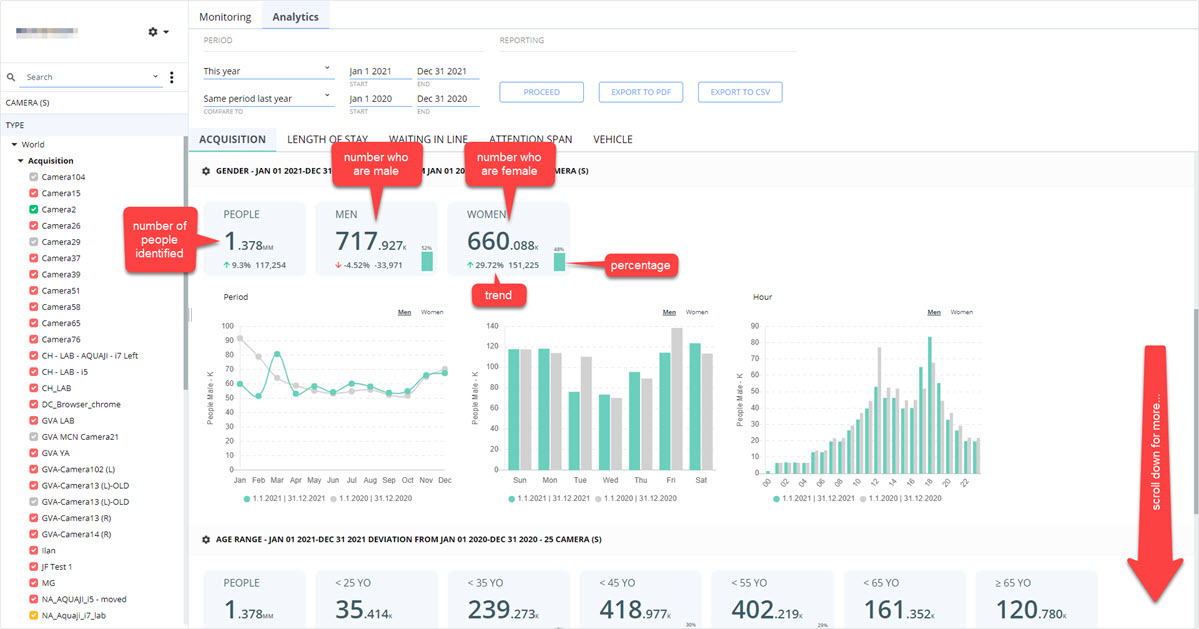
Gender data includes:
- The total number of people detected.
- The number of people who were identified as male.
- The number of people who were identified as female.
- Percentages and trends.
REMEMBER! You can click the selections above each graph or chart to change the view.
Age range
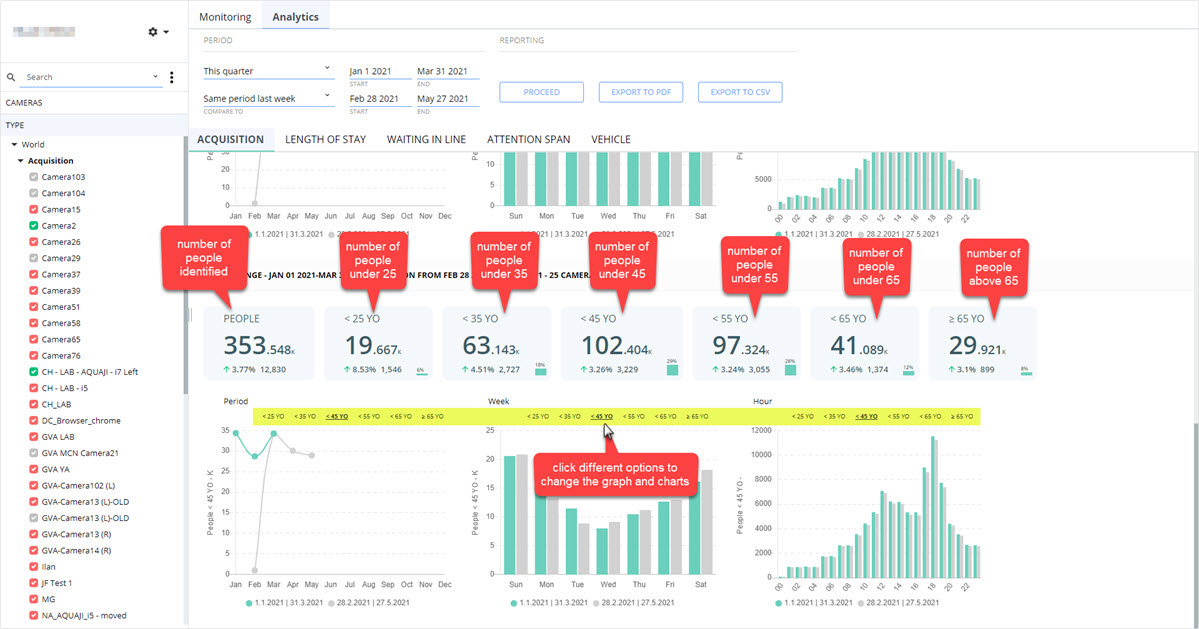
Age range data includes:
- The total number of people detected.
- The number of people who are under 25.
- ...who are under 35,
- ...who are under 45.
- ...who are under 55.
- ...who are under 65.
- ...who are above 65.
- Percentages and trends.
REMEMBER! You can click the selections above each graph or chart to change the view.